A collaborative blogpost by Dave Rice (MediaArea), Merle Friedrich and Miriam Reiche (Technische Informationsbibliothek (TIB))
Introduction
The Digital Preservation and Conservation teams of the TIB – Leibniz Information Centre for Science and Technology, Hannover, Germany are responsible for developing strategies for the conservation of physical film copies. This includes overseeing digitization of the collection as well as the digital preservation of the objects created as a result. TIB’s film collection mainly consists of 16mm film with optical and magnetic sound as well as Digital Betacam. Digitization was started in 2017, since then approximately 2,500 film titles have been digitized; another 700 film titles are planned. While digitization is carried out by external vendors, we had to develop a workflow starting with the selection of the analogue film copy and ending with the ingest of the digital files into the digital archive.
To give a brief overview of the workflow: every digital file we received from the external digitization service is subject to quality control (QC). Our QC includes automated processes such as checksum checks and validation of the files against our policy. In addition manual quality control is conducted, which includes tasks such as checking the correct naming of the files, correct content or visual detection of analogue or digital artifacts.
Each analogue film format has its own specific characteristics which will subsequently be present in the digital representation as well, but must be distinguished from digitization artifacts. An example are sprocket holes from 16 mm film which – depending on decisions made for digitization – may be visible in the digital representation as a conscious decision. An example for a digitization error, on the other hand, is playing and subsequently recording the film at the wrong frames per second speed. Many things can only be checked in real time, i.e. the actual viewing of the films. This makes quality control very time-consuming, especially in larger-scale digitization projects with few resources on the QC side. That is why we were looking for a way to optimize and support the manual QC.
With QCTools we found a suitable tool for this task, but identified several areas where expanded capabilities could aid in the efficiency or accuracy of our quality control work. By defining quality control issues that we were diagnosing by hand, we collaborated with QCTools developers to plan out new features, such as present visualizations against a timeline in addition to graphs. We also requested some new options to how QCTools saves reports to help us scale our approach As QCTools is an open source application, the contribution of development here aids not only our work, but contributes to the preservation field as a whole.
Panels in QCTools
While the graphs of QCTools provide information about the trends and events occuring on a timeline of audiovisual data, the simplicity of a plotted line graph has many limitations. We foresaw adapting the timeline structure but filling it with visual information rather than simple numbers. From this concept, we collaborated with the developers to create a concept that we called “Panels”. In panels, we would use ffmpeg to create an image per frame that was a single-pixel wide and then stack these along a timeline. Whereas QCTools would typically present a numeric value per frame over a timeline to create a line graph, this approach would create a panelled single image that depicts a particular quality of the full timeline. In our development work, we created several types of Panels for QCTools, which are reviewed below.
These panels are added in QCTools version 1.2. The Panels are a series of visual images that are presented in the graph view of QCTools, where the width of the image, from left to right, represents the timeline of the image. This allows a way to provide a visual impression of the content against the traditional QCTools graphs. For instance, this image shows an existing QCTools graph, called TOUT (or temporal outlier), which gives an impression of the glitchiness of the frames and below the graph is a panelled image comprised of taking only the single column of pixels from each frame and showing them aligned on the same timeline. This example shows the correlation of the trends in the temporal outlier graph to the white speckle of a damaged videotape in the panel.
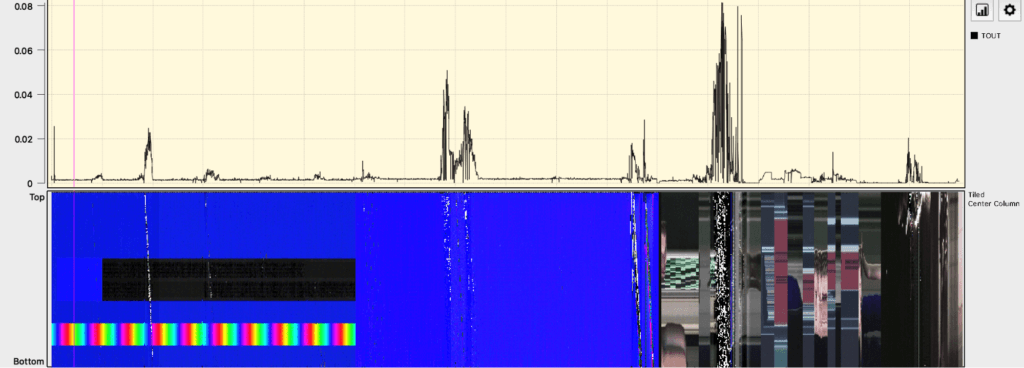
Digibeta Artifacts
The panel “Tiled Center Row” can be used to detect artifacts like these vertical lines in a digitized digital betacam:
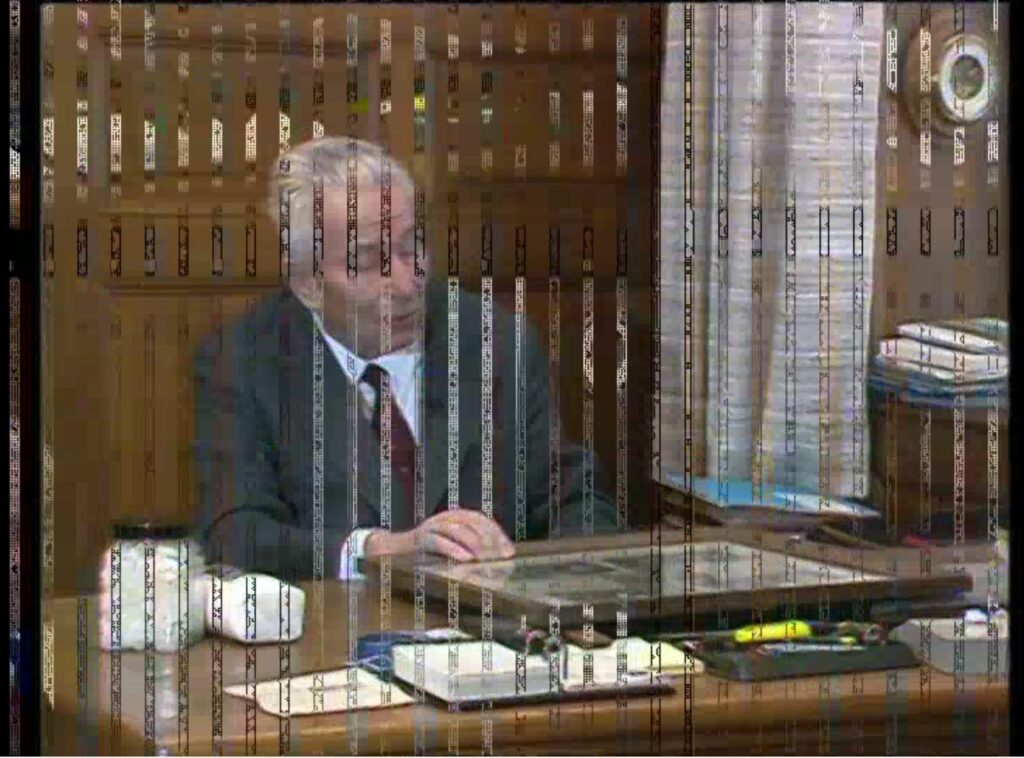
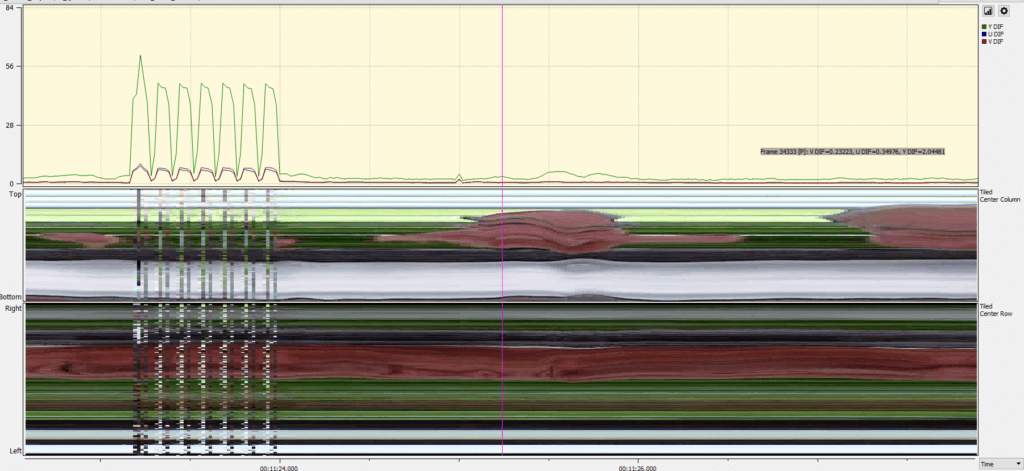
The “Differences” graphs show an unusual pattern as a Digital tape player inserts odd artifacts into alternate frames of vertically stacked, misplaced pixels. This image shows how this error is represented in both the “Differences” graph and “Tiled Center Row”.
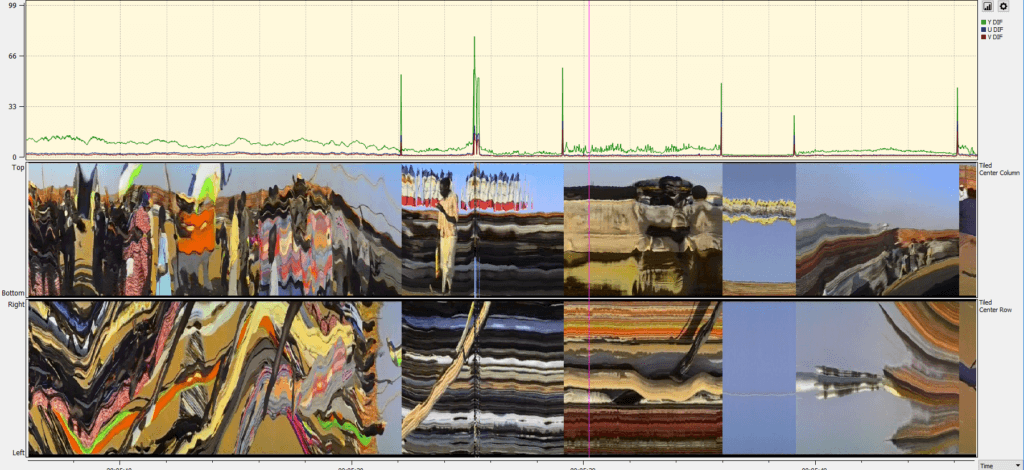
Panels also clarifying scene changes. While a single-frame spike in the “Differences” graph can indicate a scene change, it could also indicate a single-frame error that causes one frame is substantially different than its predecessor. The panelled images of “Tiled Center Column” and “Tiled Center Row” help indicate to a reviewer that the spikes are indeed occurring at scene changes.
Horizontal Blur

This image shows the impact of the “Horizontal Blur” panel, which depicts the amount of blur in the frame from left to right (the image is rotated so the left edge of the frame is depicted at the bottom of the Horizontal Blur panel and the right at the top). In most of the scenes a speaker is in focus and centered in the frame, so the center is brighter representing focus and the sides are darker representing blur. Later in the clip, a variety of focal lengths are applied to the camera lens shifting where in the frame the focus is.
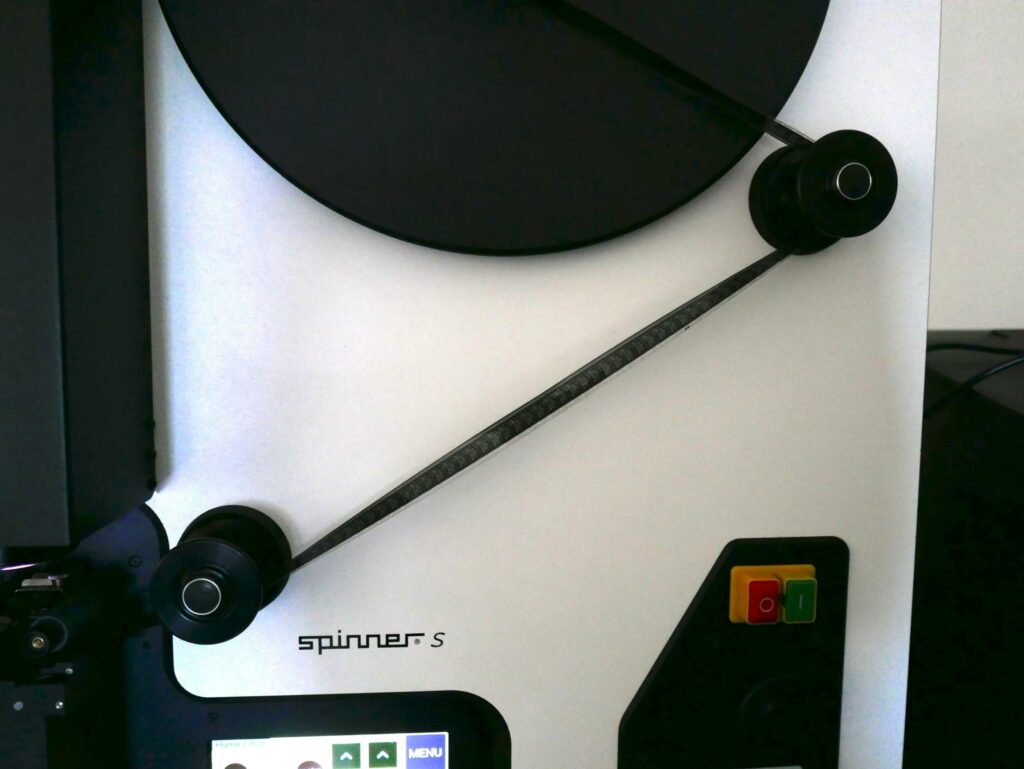
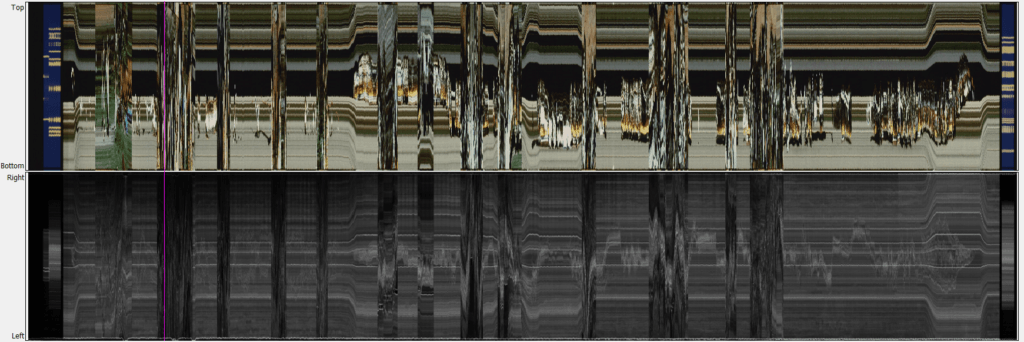
This image comes from a film scanner, where the shrunken film wobbles its way through the scanner. In the picture below it shows the Horizontal Blur panel of a wobbly film. Here the right edge, shown on the top of the Horizontal Blur panel, is darker than the left edge through the majority of the transfer. The panel helps to detect films where the handling of the film during digitization leads to a continuous blur on one of the sides.

This screenshot of the Horizontal Blur shows another film with the same pattern: the bottom of the panel shows for the most part black or dark grey shades which indicate blur. But also for the part where it is lighter, it is never clearly white. This could indicate that the left side of the film is constantly blurry. For the quality control this would mean to jump to the brightest parts of the film and check the actual image there. Is there still some bluriness?

The picture above is taken from one of the brighter parts of the horizontal blur panel: The left part of the image is clearly blurry compared to the other plants in the background which are sharper. Films with a continuous blur on one side thus can be detected in best case in one glimpse of an eye on the horizontal blur panel, and in cases like the depicted one with a few jumps to relevant parts of the film.
Audio Alignment
For many of our films, we have the soundtrack in multiple forms, such as an optical track on the film print and also an additional audio track on a separate magnetic audio reel. In our digitization work, we wanted to store the multiple audio expressions in the same container, so that the optical and magnetic audio were synchronized with the frames of the film. Verifying the quality of this digitization work involves ensuring that the multiple audio tracks are synchronized.
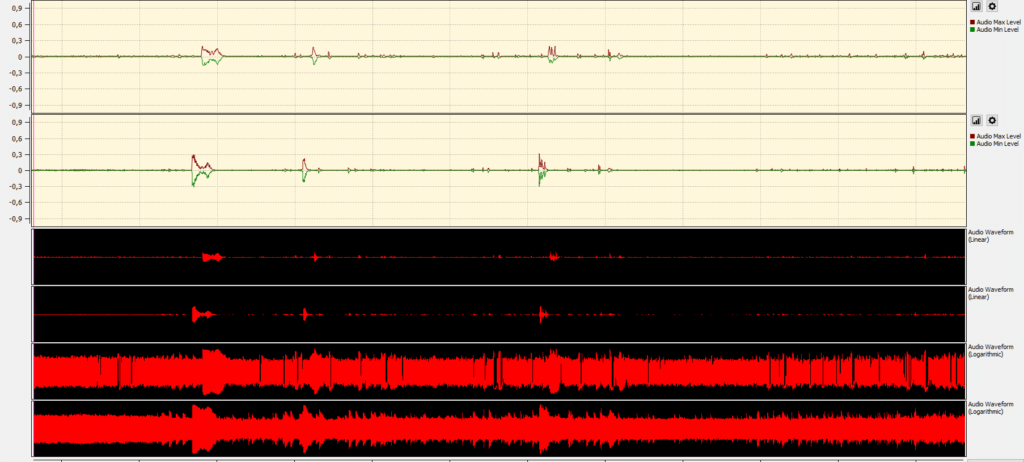
This image shows a film transfer where the first track captures the optical sound track on the film print and the second track captures the magnetic soundtrack. The panels and graphs of the audio waveform reveal that the audio from these two sources is not quite synchronous. Also the optical sound track, particularly in the “Audio Waveform (Logarithmic)” panel track shows dropouts in the optical sound track where the emulsion is scratched.
Tiled Center Column (Field Split)
With some Panels, their best application can conditionally depend on if the source material is interlaced (such as most videotape) or progressive (such as film). While taking the center column or row of a visual track and presenting it on a timeline can reveal a lot of the video’s characteristics over time, this information could mislead if the odd lines and the even lines of source material are acting independently (such as with a video head clog or dirty videotape player).
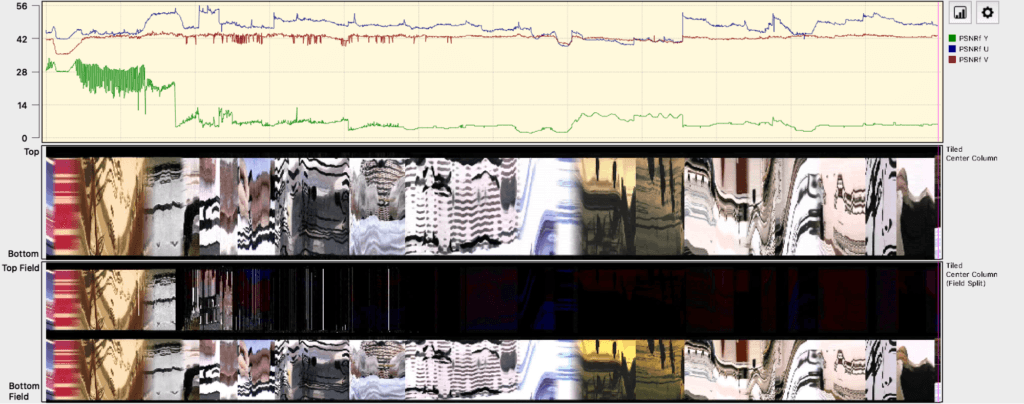
The “Tiled Center Column” filter takes the center column of pixels from each frame and stacks them left to right. As analog video is interlaced, often presenting the two fields of video stacked upon one another, rather than interleaved together as usual, can reveal errors better. In this example, a head clog in the video playback deck blocks the signal of one field. In “Tiled Center Column (Field Split)” the two fields are stacked before the Tiled Center Column filter is applied, thus the top half (where the head clog occurs) becomes much darker than the bottom field.
Vertical Line Repetition and Tiled Center Column
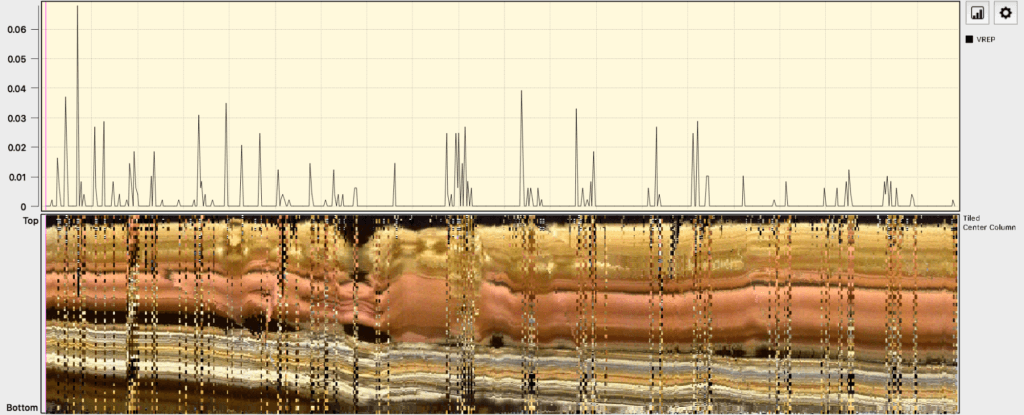
This example shows a U-matic tape transferred through a DPS-275 timebase corrector. As the tape was significantly deteriorated some sequences contained a weak signal. The timebase corrector would buffer single lines of video in a small digital memory. When the signal was too weak, the timebase corrector would simply output the same digital line instead, resulting in a digital file where the same line would occur multiple times in a row. Since analog tape has noise, even under ideal conditions it would not be able to produce identical rows of digital pixels, so QCTools tallies these lines as VREP or vertical repetition. This example shows the graph of VREP against the panelled image of Tiled Center Column, correlating the error with the appearance.
Chroma Noise
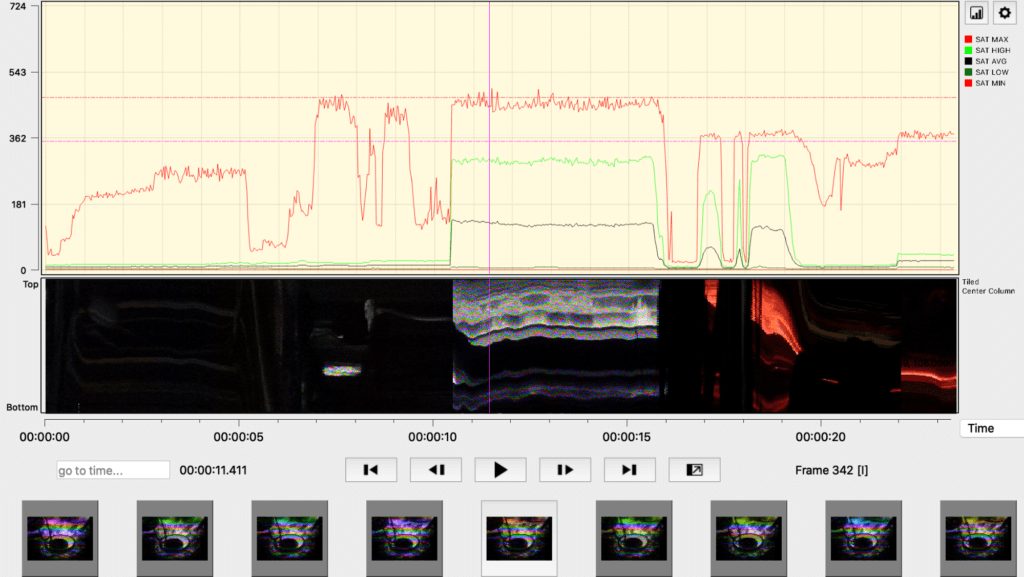
Here the over-saturated image results in a vibrant pattern of red, green and blue colors strobing across a few scenes of the video. This image aligns the saturation graph, showing the high, out-of-broadcast range levels of saturation against the impression in the resulting images from Tiled Center Column.
Analysis at Scale
As film images are so much larger than video images, running QCTools on film would take more time and the reports would require more space. To better optimize our workflow, we used our servers to run the QCTools command-line tool (qcli) to generate the QCTools reports at scale. Normally qcli and QCTools would store these reports in a gzipped XML file next to the audiovisual film being analysis; however, because of the introduction of the Panel features described above, the default QCTools report file was moved from a gzipped XML file to a Matroska file. The Matroska file then contains the gzipped XML data as well as the visual information of the Panel tracks and the thumbnails of each frame.
Rather than storing these reports next to each audiovisual file analyzed, we supported the development of a feature called QCvault, where the relationship between the QCTools report and the file that the report represented, could be defined. With this setting, reports could be next to the analyzed file as before or now the reports could be stored in a separate pre-defined location. This allows us to manage audiovisual files and QCTools reports independently.
File size of the reports
With the new panels feature the format of the reports change. While before it was an xml, now it is wrapped in a Matroska container. Saving the analyzed panel images also leads to larger file size of the reports. Here are our very first examples of digitized 16mm film and their report sizes. Many factors play a role in how large the video file gets as well as how large the report is. Which is why there is some more context on the analogue original and the digital preservation master which was used to create the report.
| Physical Carrier: | Digital preservation master: | File size in MB/Min | Report size in MB / Min |
| 16mm film, black and white, optical sound, 24 fps | Mkv, ffv1, 10 bit, 2018×1536, 24 fps | 2340 | 56,7 |
| 16mm film, color, no sound, 24 fps | Mkv, ffv1, 10 bit, 2018×1536, 24 fps | 3670 | 22,6 |
| Digital Betacam, color, interlaced | Mkv, ffv1, 10 bit, 720×576, YUV 4:2:2, interlaced | 911 | 3,2 |
Conclusion
With the new version of QCTools we facilitate the process of the visual quality inspection of the digitized films and Digital Betacams. Before we had a workflow where we inspected the digitized audio-visual material in real time, sometimes switching the audio streams back and forth between optical and magnetic sound. Now we can see the issues which we claimed before visually, e.g. audio streams which are not aligned. And with the panels there is a great way to contextualize the graphs.
If not stated otherwise, text and images CC-BY 3.0 Germany https://creativecommons.org/licenses/by/3.0/de/deed.en


